
I first played the game Agricola back at Uni. in 2012, and I bought my first copy in 2016, I played now and then with friends during my studies. But when you grow up and everyone is scattered around, the time to play with other adults also disappears.
In a busy everyday life with two small kids and work around the clock, there isn’t much time for one of my favourite hobbies; board games with adults. Snakes and ladders won’t cut it (sorry kiddos!). But luckily, there is a community of Agricola fans in Norway, and it happens to be my favourite game. They organise tournaments at sea (among other venues) playing for a whole weekend. Whenever one of those weekends fits my calendar, I jump on it!
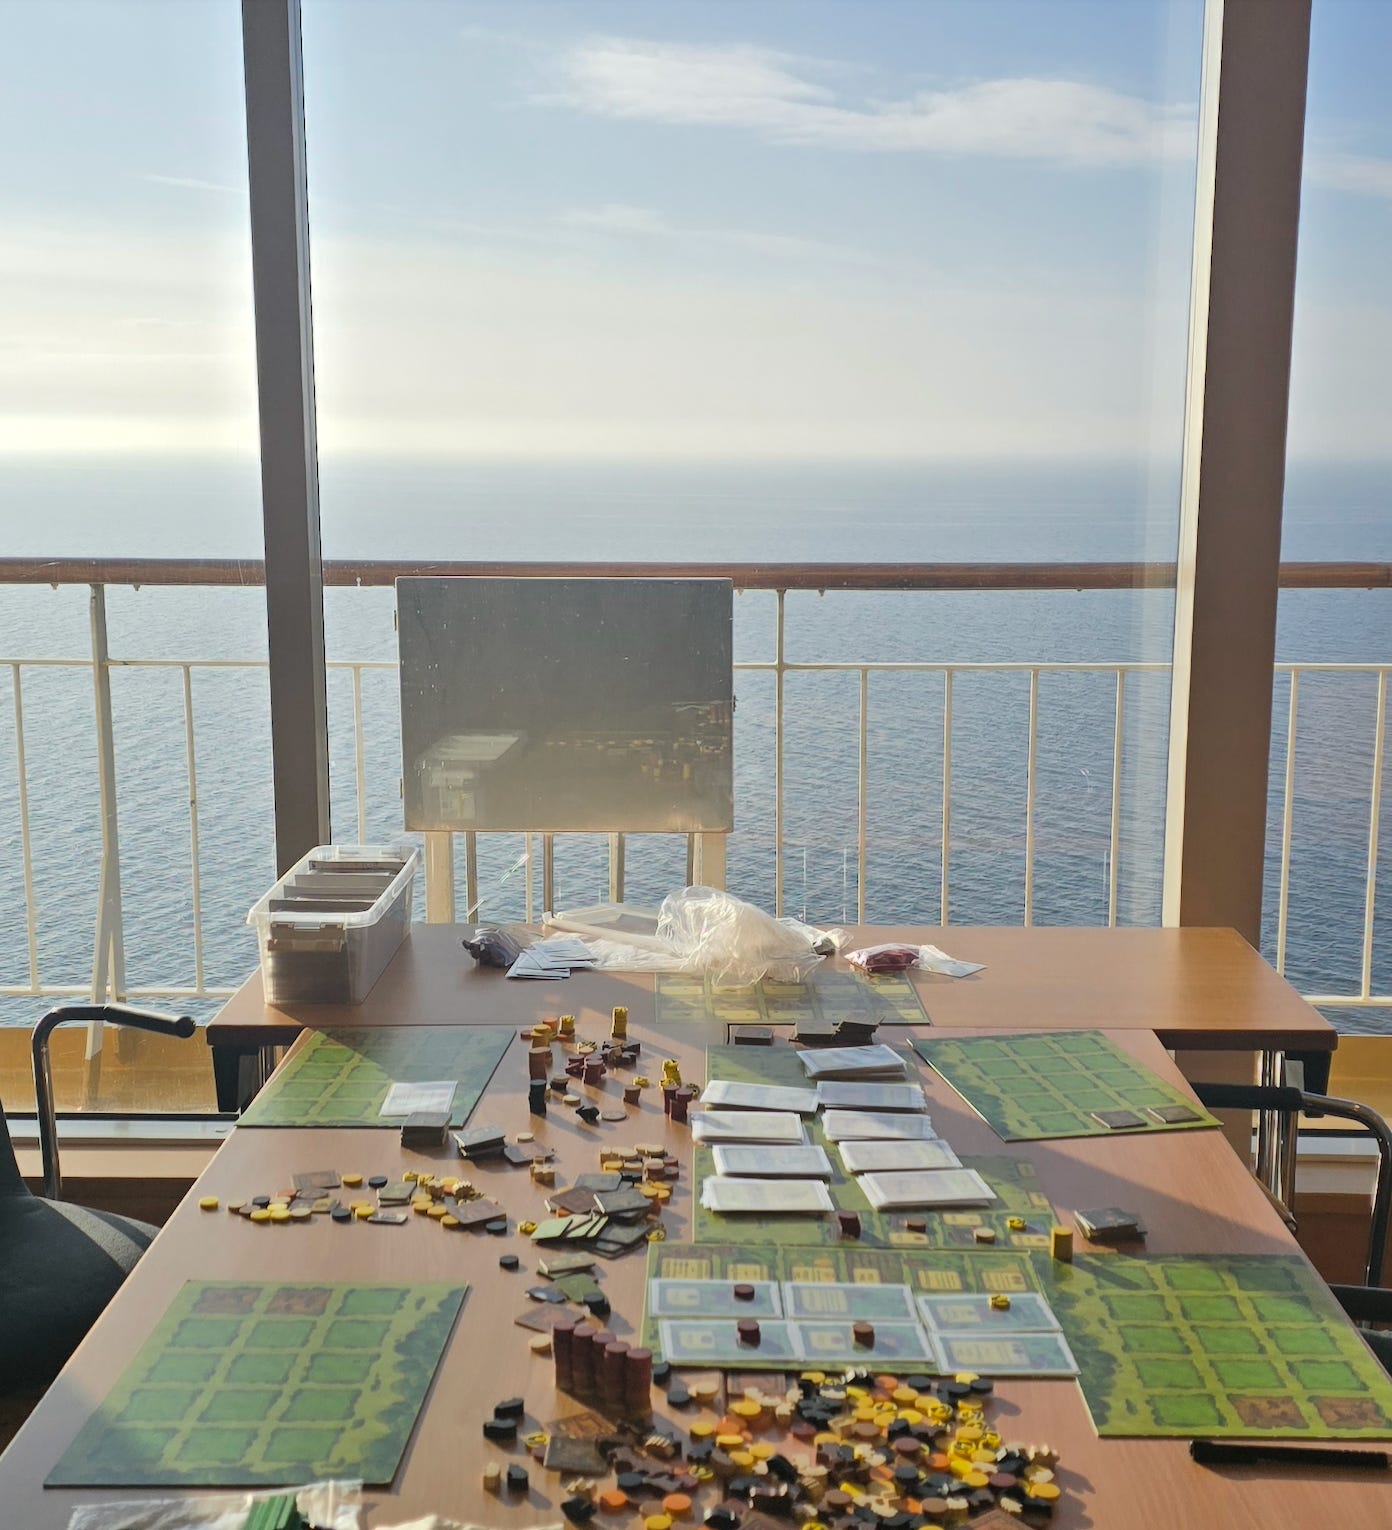
There’s a catch, tho. I don’t own the tournament card decks! The Revised cards in my core game aren’t much use in competitive play, and when you only sit down to play with adults every other year, you can’t just rely on memory. Nearly 2k unique cards across dozens of decks and expansions! One needs to study them, browse them, draft them and play them to understand which cards work well together.
So, I built Agricola Explorer! A web app for browsing, drafting, and analysing the full card pool. With iterative updates and improvements shaped by feedback from the Norwegian Agricola community. I built the knowledge graph engine, ontology and OTTR-templates, and vibe coded the rest with my friend Calude. Rapid back-and-forth sessions turning ideas into features.
The interesting technical part isn’t the React front-end or the FastAPI server. It’s what sits between them: the knowledge graph engine powered by maplib, a Python library for building RDF graphs from any data source using OTTR and other mapping techniques.
The problem with flat data
The card data starts its life as a JSON file with 1898 entires, each with a name, type, deck, cost string, card text, and some tournament statistics. A CSV file adds competitive play data: how often each card is drafted, played, and wins. An Excel spreadsheet contributes curated corrections and definitive Norwegian tournament deck list of 965 cards.
Three sources, different schemas, overlapping (but not identical) card pools. The classic data integration headache.
A relational database could handle this, but the interesting question about Agricola cards aren’t tabular. They are relational! “Which card produce grain?” leads to “Which cards cost grain” leads to “So which cards work well together?”. That’s a traversal, not a join.
Enter maplib
maplib is a Python library built on Apache Arrow that lets you define RDF graph templates (using OTTR) and then map tabular data (Polars DataFrames) directly into a knowledge graph based on the serialisation instructions in the template(s). The result is a fully queryable RDF knowledge graph that you can run SPARQL against.
The core idea is simple: you define what a “Card” looks like in your ontology, then point maplib at your DataFrame and say “each row is a Card”. It handles the rest; minting IRIs, creating triples, enforcing types.
Here’s the actual template that defines an Agricola card in the system:
:Card [
    ? xsd:string ?Card_ID,
      xsd:string ?Name,
    ? ottr:IRI   ?Type,
    ? xsd:string ?Deck,
    ? xsd:string ?Cost,
    ? xsd:string ?Card_Text,
    ? xsd:double ?win_ratio,
    ? ottr:IRI   ?hasCost,
      ottr:IRI   ?subject ] :: {
  ottr:Triple(?subject, rdfs:label, ?Name),
  ottr:Triple(?subject, rdf:type, ?Type),
  ottr:Triple(?subject, def:Deck, ?Deck),
  ottr:Triple(?subject, :hasCost, ?hasCost),
  ... # and more!
} .
And here is how the mapping happens in Python:
from maplib import Model

m = Model()
m.add_template(open("tpl/tpl.ttl").read())
m.map(ns + "Card", cards_dataframe)
m.map(ns + "CardGain", gains_dataframe)
m.map(ns + "CardAffect", affects_dataframe)
m.map(ns + "CardRelation", relations_dataframe)
m.map(ns + "CostPermutation", cost_permutations)
m.read("ontology.ttl")
Five template mappings, five DataFrames, and the graph is built. The model loads at server startup and stays in memory, ready for SPARQL queries.
What the graph makes possible
Once data lives in the graph, queries that would be awkward in SQL become natural. The Card Explorer exposes a SPARQL editor where users can write arbitrary queries against the live model. But behind the scenes, the more interesting use is in the structured filter system.
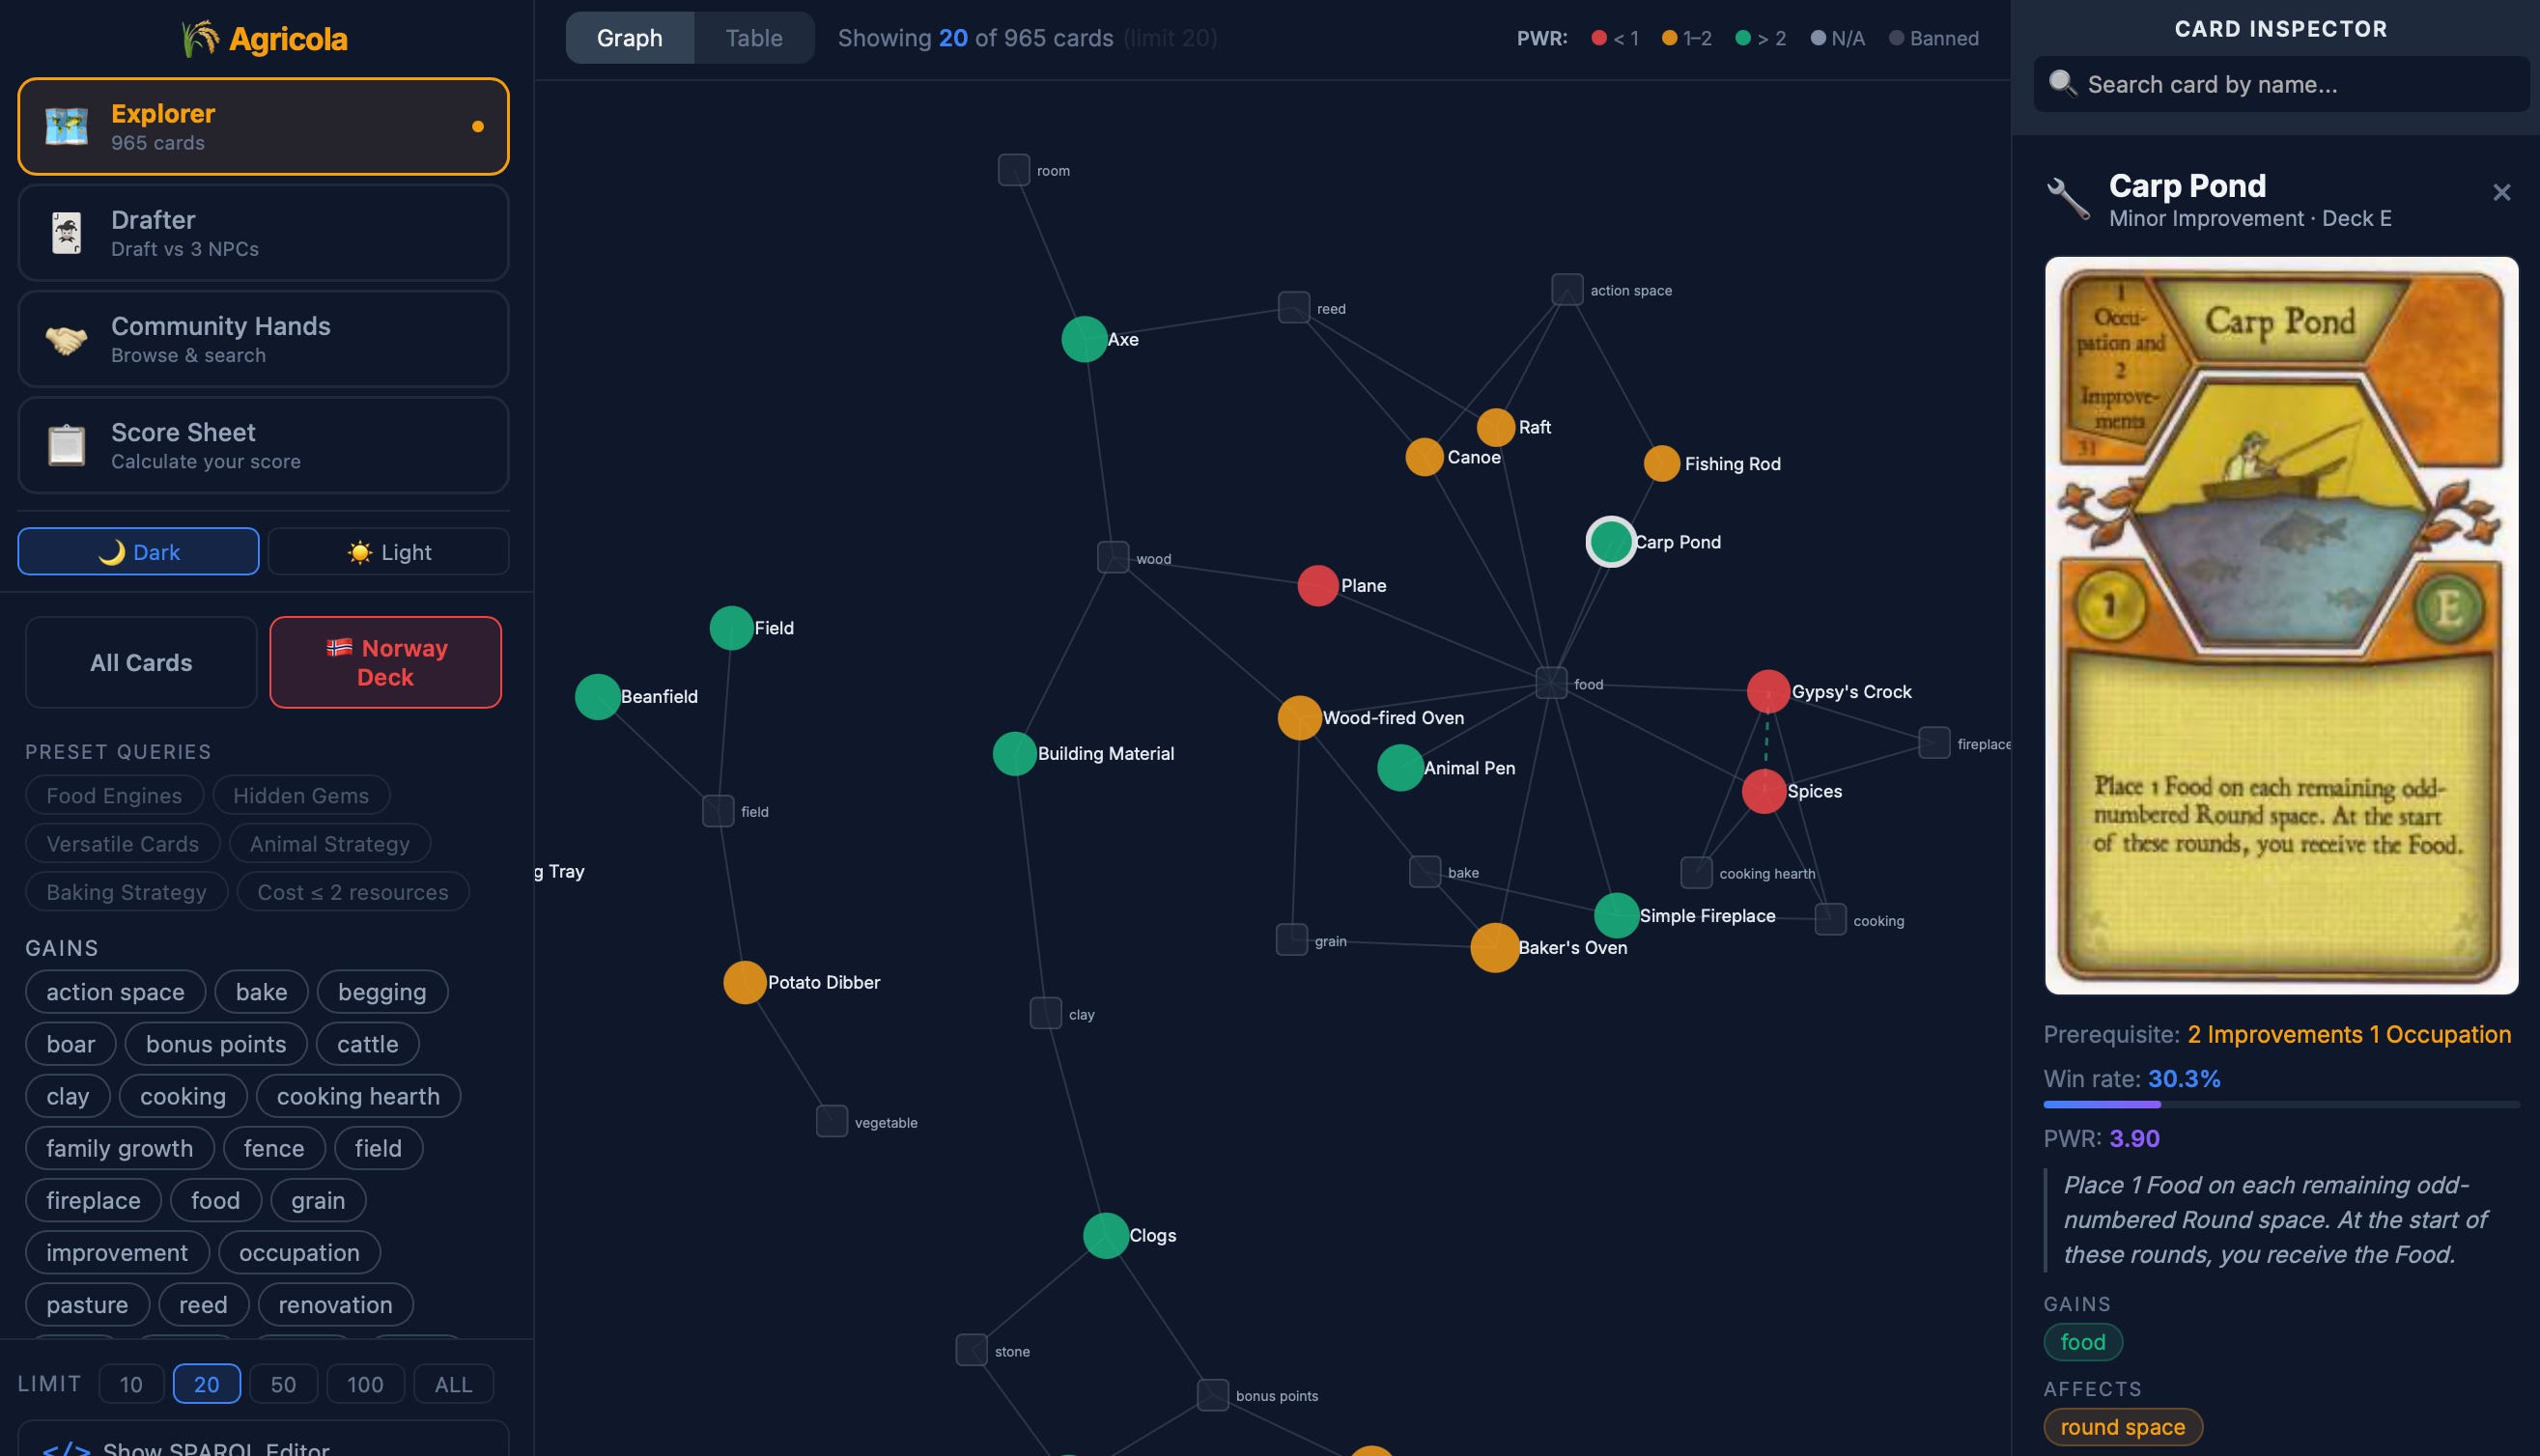
When a user selects filters, for example cards that gain grain and affect sowing, the font-end builds a SPARQL query:
PREFIX : <http://veronahe.no/agricola/>
SELECT ?name ?deck ?winRatio
WHERE {
  ?card rdfs:label ?name ; def:Deck ?deck ; def:win_ratio ?winRatio .
  ?card :gains :grain .
  ?card :affects ?aff . FILTER(?aff IN (:sow))
}
ORDER BY DESC(?winRatio)
This hits the maplib model on the back-end and returns results in milliseconds. The graph pattern matching is doing real work here; it’s not just filtering columns, it’s traversing relationships between cards, their gains, their costs, and their effects.
Inferring card combos from graph structure
The most ambitious use of the graph is combo detection. Agricola strategy revolves around card synergies; cards that are individually decent, but become powerful together. The system infers these combos from the graph structure using rules that would be natural datalog, but are currently implemented in Python due to datalog being a part of the licensed version of maplib, and I chose to keep my repo open sourced. However! If you’re interested in trying out the datalog part of maplib, reach out to Data Treehouse for a private exploratory license.
Anyways, here are a few example of card combo rules:
Supply chain combos
If Card A gains grain and Card B costs grain, they have a supply-chain synergy. With nearly 2000 cards, there are only 13 that cost grain, so these connections are genuinely meaningful.
# Datalog equivalent
[?a, :worksWellWith, ?b] :-
    [?a, :gains, :grain],
    [?b, :hasCost, ?cost],
    [?cost, :grain, ?v],
    FILTER(?a != ?b) .
Animal husbandry combos
Cards that gain animals are matched with cards that affect breeding, but only if the animal-producing card also provides infrastructure (pastures, fences, stables). This tightening avoids the combinatorial explosion of connecting every sheep card to every breeding card.
# Datalog equivalent
[?a, :worksWellWith, ?b] :-
    [?a, :gains, ?animal],
    [?a, :gains, ?infra],
    [?b, :affects, :breeding],
    FILTER(?animal IN (:sheep, :boar, :cattle)),
    FILTER(?infra IN (:pasture, :fence, :stable)),
    FILTER(?a != ?b) .
Baking strategy combos
Grain producers are linked to baking cards, but only those that also affect sowing or harvesting. Identifying. cards that support a complete grain-to-bread pipeline.
# Datalog equivalent
[?a, :worksWellWith, ?b] :-
    [?a, :gains, :grain],
    [?b, :gains, :bake],
    [?b, :affects, ?mechanic],
    FILTER(?mechanic IN (:sow, :harvest)),
    FILTER(?a != ?b) .
Card reference combos
Many Agricola cards mention other cards by name in their text. The system parses these references, resolves them to graph subjects (IRIs), and creates bidirectional combo links.
# Datalog equivalent
[?a, :worksWellWith, ?b] :-
    [?a, :relatedTo, ?b],
    FILTER(?a != ?b) .

[?b, :worksWellWith, ?a] :-
    [?a, :relatedTo, ?b],
    FILTER(?a != ?b) .
These rules produce thousands of combo pair that surface in the UI when users browse or draft cards. The graph representation makes these rules readable and composable, each one is a pattern over the same underlying triples.
The data engineering pipeline
Getting clean data into the graph turned out to be the hardest part. The card text is natural language, and extracting structured information from it required building a domain-specific NLP pipeline (a collection of regex patterns and keyword extractors turned to Agricola’s vocabulary).
The pipeline runs through several stages:
Load and merge:
cards.jsonprovides the base card data, the tournament CSV adds statistics, and the curated Excel contributes corrected power ratings and Norwegian deck membership (matched by uuid).Cost parsing: cards costs like “1 Wood, 2 Clay” are parsed into structured resource vectors and minted as IRI nodes so the graph can reason about resource requirements.
Text annotation: card text is scanned for gain keywords (grain, wood, sheep, family growth, …), effect keywords (sow, harvest, breed, renovate, …), and card name references. Each annotation becomes a separate triple in the graph.
Combo inference: the rules described above run over the annotation DataFrames to produce synergy pairs.
Template mapping: the cleaned DataFrames are mapped through OTTR templates into the RDF model.
All of this runs at server startup. The entire pipeline; loading three data sources, parsing 1898 card texts, inferring combos, and building the graph.
Why not just use a database?
Fair question. A PostgreSQL database with a few well-designed tables could serve card data and handle filtering. For a simpler app, that would be the right choice.
The knowledge graph earns its keep in three ways. First, the SPARQL interface gives power users the ability to ask questions nobody anticipated. “Show me all 3+ player occupations from the Globus deck that cost food and affect renovation” is a valid SPARQL query, not a feature request. Second, the combo inference rules are more naturally expressed as graph patterns than SQL joins, especially when they need to chain multiple relationship types. Third, the OTTR template approach made the data model remarkably easy to evolve. Adding a new card property means adding a column to the DataFrame and a line to the template, not a database migration.
The tech stack
For anyone considering a similar approach: the full stack is Polars for data engineering (fast, expressive DataFrame library), maplib for RDF graph construction and SPARQL for querying, FastAPI for back-end API, React for the front-end, and SQLite for the mutable data (saved hands and scores). The knowledge graph handles the ready-heavy, relationship-rich card data; SQLite handles the write-heavy, simple-schema user data. Each tool does what it’s good at.
maplib is still a relatively young library, but it’s remarkably smooth. The OTTR templates are clean abstraction over raw RDF, and the Polars integration means you can do heavy data wrangling before anything touches the graph.
Summary
Building a board game companion app might seem like overkill territory for knowledge graphs. But Agricola’s card pool is genuinely complex. Thousands of entities with types relationships, strategic interdependencies, and a community that asks sophisticated analytical questions. A knowledge graph didn’t just fit the problem; it made features possible that would have been painful to build any other way.
If you’re working with richly interconnected domain data, whether it’s board game cards, recipe ingredients, or hardware components, and you find yourself writing increasingly tortured SQL queries to express relationship patterns, it might be worth reaching for maplib and seeing what your data looks like as a graph.
Agricola Explorer is an open-source project. The maplib library is available on PyPi.
About the author

Ontologist who code in C, Java and Python. Been a knowledge graph practitioner for over a decade, and had numerous talks on the topic around the globe. Author of SHACL for the Practitioner and awarded amongst Norway’s Top 50 Women in Tech 2024.