

Over the past four articles, we have built up the full journey from data engineering to knowledge engineering, one concept at a time. We started with the why in Why Should You Care About Knowledge Graphs?, moved to the first practical steps From Data Engineering to Knowledge Engineering in the blink of an eye, connected our data to formal meaning in Data Engineering Ontologies, learned the query language SPARQL for SQL Developers, and finally tackled data quality the graph way with SHACL: Declarative Data Validation.
Each article focused on one piece of the puzzle. This one puts them all together.
The masterclass is a self-contained project that demonstrated every concept from the series, applied to a realistic CRM domain with multiple data sources, just like you’d encounter in any modern data platform. No planets this time! Customers, orders, products, and support tickets. The messy, multi-source reality that data engineers deal with every day.
Why customer data?
In the opening of part 0, the product manager asks a “simple” question about customers with active subscriptions who filed support tickets. Three different identifiers. A day and a half of LEFT JOIN gymnastics.
I’ll summarise the series into a demonstrator project using data as this, even though the main concepts are described using planet data. Customer data is a bit closer to real-life use cases. So, this demonstrator uses:
25 customers from a Parquet file (the native format of Databricks and lakehouse architectures)
60 orders from a CSV file (the format that refuse to die)
15 products from an Excel file (because someone in the business always manages the product catalog in a spreadsheet)
40 support tickets queries via a SQL endpoint, simulated using Polars’
SQLContext
Four sources, four formats, one knowledge graph!
Entity harmonisation: the real challenge
When I shared my articles in various channels, I got several feedbacks on how knowledge graphs can solve unification of multiple source systems? And how do you know that two entities are the same?
These are the right questions. And the honest answer is: a knowledge graph doesn’t magically solve entity resolution. You still need to do the mapping work. But it gives you a much better framework for it.
In the demonstrator, the four source systems use their own naming convention. Just like any real organisation!
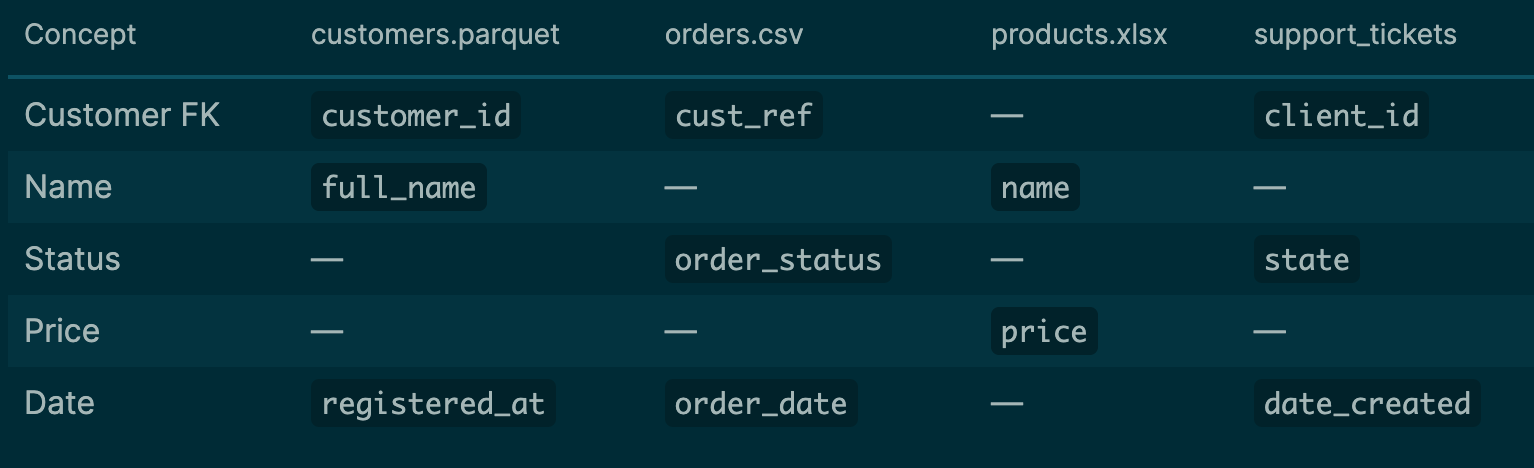
The same customer foreign key has three different names. The column name means a person in one file and a product in another. Dates are registered_at, order_date, and date_created.
data_engineering.py handles this explicitly. Each function reads the raw source, then renames columns to a shared vocabulary before constructing IRIs. The order system’s cust_ref becomes customer_id. The ticket system’s client_id becomes customer_id. The product catalog’s sku becomes product_id. And so on…
This is the mapping magic! It’s not glamorous. It’s df.rename() calls with comments explaining why. But it is the step that makes everything else possible, because once every source uses the same identifier for the same entity, the IRI construction produces the same IRI across all sources. And once you have a shared IRI, the graph connects the data automatically.
The key insight: in a knowledge graph, identity is an IRI, not a column name. The data engineering layer constructs that IRI constantly across sources, and the ontology gives it meaning. Two different columns in two different systems can produce the same IRI for the same customer, and from that point on, every relationship (orders, tickets, products) connects through the graph without a single JOIN.
But what happens when you don’t have a shared key at all? When two systems call the same drug by different names, or when “Bjorn” and “Bjørn” might be the same person? That’s entity resolution in the wild, and it’s genuinely hard—in any paradigm, not just knowledge graphs. But the graph gives you a place to express and query these alignments once you’ve made them. You can use owl:sameAs, skos:exactMatch, or any other defined equivalence mapping resources, or custom made resources for this job. The alignment becomes a first-class citizen in the data, not a hidden JOIN condition buried in a view.
In the blink of an eye
In part 1, we showed the minimal path: read a CSV, create IRIs, map into a RDF Model, and query. This demonstrator follows the same pattern, but scales up and with the harmonisation step that the part 1 didn’t need (because it had only one source).
data_engineering.py is where the data engineering happens. Each function reads from a different source format, harmonises column names to a shared vocabulary, and prepares a Polars DataFrame with IRIs that will become subjects and references in the knowledge graph. The comments walk you through what’s happening and why; which column gets renamed, which becomes an IRI, which becomes a literal, and how foreign keys turn into graph edges.
The Polars SQLContext deserves a special mention. In the article series, we talked about how data engineering already work with SQL. The support_tickets() function registers a DataFrame as a virtual SQL table and queries it with standard SQL, including the column renaming via SQL aliases, before feeding it into the graph. This pattern bridges the gap; you can keep thinking in SQL at the data engineering layer, while the knowledge layer does the heavy lifting on relationships and meaning.
Templates instead of default mapping
Part 1 used map_default() for simplicity. The demonstrator uses explicit OTTR templates (tpl/tpl.ttl), which give you full control over how your data frame columns map to RDF triples. There is a template for each entity type as Customer, Order, Product and SupportTicket, each declaring exactly which columns become IRIs (! ottr:IRI) and which become types literals.
This is the bridge between “I can get data into a graph” and “I can model data properly”. The templates are your mapping contract.
Ontology: the knowledge layer
Part 2 was all about connecting your data to meaning. The demonstrator ontology (ttl/ontology.ttl) defines the CRM domain: what a Customer is, what an Order is, how they relate (:placedBy, :contains, :raisedBy), and what properties each class has. It also defines classification hierarchies. PremiumProduct and BudgetProduct as subclasses of ProductCategory, and customer segment classes like HighValueCustomer and AtRiskCustomer.
This is the knowledge in a knowledge graph. Without it, you have graph data. With it, you have a knowledge graph—data that carries its own meaning. ❤️
Reusing existing knowledge: SKOS, DCAT and FIBO
Part 2 made the point that you don’t have to build everything from scratch, there are published ontologies out there, and the power of knowledge graphs comes from connecting to them. The demonstrator puts this into practice with three well-known standards.
SKOS
Simple Knowledge Organisation System (SKOS) provides the vocabulary layer. Product categories like “Software” and “Hardware”, customer segments as “Enterprise” and “SMB” issue types, and priority levels are all defined as proper SKOS ConceptScheme in ttl/vocab.ttl, with skos:prefLabel, skos:definition, skos:related and skos:broader relationships between them. The raw data has plain strings. A set of INSERT queries (queries/link_*_to_skos.rq) matches those strings against skos:prefLabel and creates types links (:hasCategory, :hasSegment, :hasIssueType, :hasPriority). After that, you can navigate from any product to its category concept, read its definition, and discover related categories through the graph!
DCAT
Data Catalog Vocabulary (DCAT) describes the data sources themselves. The file ttl/catalog.ttl defines a dcat:Catalog containing four dcat:Dataset entries, one for each source, with their distributions, media types and descriptions. This is metadata that travels with the knowledge graph. Any system that speaks DCAT (and many do, especially in the European public sector) can discover and understand these sources automatically.
FIBO
Financial Industry Business Ontology (FIBO) provides the industry alignment. The ontology links our CRM classes to FIBO Foundations concepts: :Customer, is a subclass of fibo:AgentInRole (a party playing a role), :Order is a subclass of fibo:MutualCommitment (a bilateral arrangement), and :Product aligns with fibo:Product. These links are lightweight, just subclass statements, but they connect our little CRM graph to a global, standardised vocabulary used across financial services. If someone else’s graph also uses FIBO, the two become interoperable for free.
This is exactly the pattern part 2 described; you build your domain model, then you connect it outward to existing knowledge. Same data, but with richer meaning and instant interoperability.
Inference: deriving facts you didn’t state
The Datalog rules in ttl/rule.dlog are where the graph starts doing things SQL cannot. Five rules derive new facts:
Inverse relationships: if an order is
:placedBya customer, the customer:hasOrderthat order. Same for tickets.Transitive purchasing: if a customer placed an order that contains a product, then the customer
:purchasedthat product. This is a two-hop inference that collapses what would be aJOINin SQL into a direct relationship.Product classification: products are automatically classified as
:PremiumProduct(price > 500) or:BudgetProduct(price ≤ 100) based on their:unitPrice.
After running m.infer(rules), you can query :purchased as if it were stated directly in the data. No JOINs or subqueries. The reasoning engine did the work, adding new explicit facts to your knowledge graph.
SPARQL: asking questions SQL can’t
Part 3 showed the translation from SQL to SPARQL. The demonstrator includes 8 competency questions (queries/cq1.rq through cq8.rq) that go beyond translation. They demonstrate things that SPARQL does naturally and SQL does painfully, or not at all.
Each file contains the full SPARQL query, a prose explanation of why it’s interesting, and a SQL equivalent in the comments so you can see the contrast. Here are a few highlights:
CQ1: queries the inferred
:purchasedrelationship. The SQL equivalent needs aJOINthrough orders, but in SPARQL, you just ask for it.CQ4: does schema introspection: “what classes exist in this graph, what properties belong to each, and how many instances?” In a knowledge graph, the schema is data. In SQL, you’d need to mix information_schema with instance queries, which isn’t possible in a single statement.
CQ6: is the relational division problem: “which customers purchased products from all categories?” This is notoriously awkward in SQL (double-NOT-EXISTS or HAVING COUNT = subquery). In SPARQL, it’s a subquery with a HAVING clause.
CQ7: uses CONSTRUCT to return a graph, not a table. SQL literally cannot do this. You’d need application code to assemble a graph structure from multiple query results.
Validation: trusting the data
Part 4 introduced SHACL shapes for declarative data validation. The demonstrator includes shapes (ttl/sh.ttl) that validate the graph. Every Customer must have an email and a country, every Order must be placed by a Customer.
When you run validation, you get a machine-readable report with triples that describe exactly what went wrong, which focus node violated which shape. And you can query that report with SPARQL!
The full picture
Here is what this project demonstrates, mapped back to the article series.
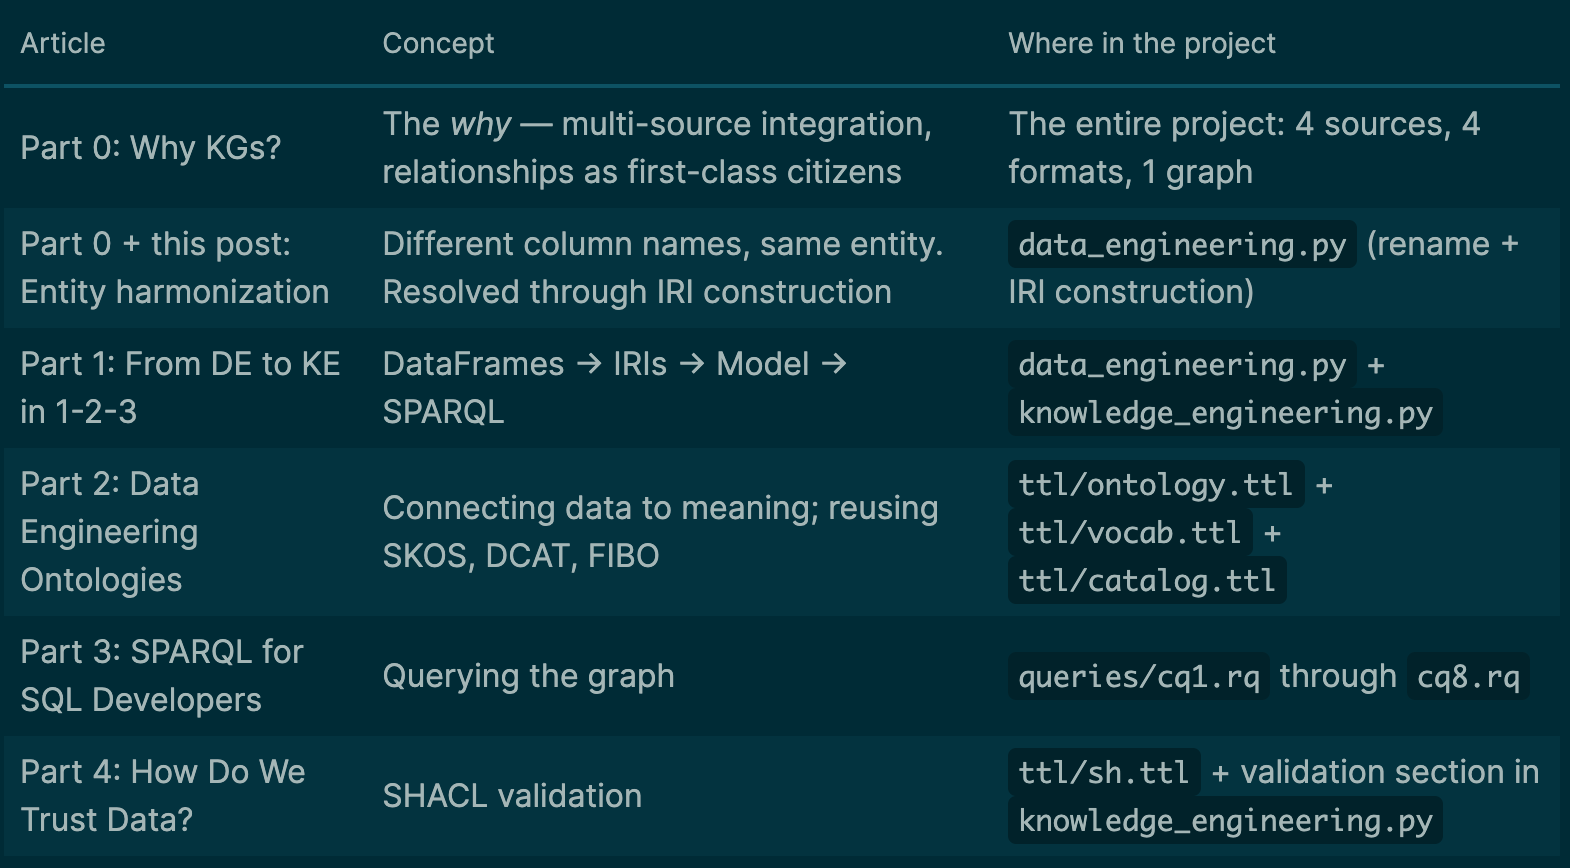
Try it, break it, extend it !
The demonstrator is designed to be extended. Add a fifth data source. Write new SHACL shapes. Add more inference rules. Connect it to a public ontology. Write a competency questions that federates against Wikidata.
The tools are here. The standards are mature. Now, go play! ✨
The demonstrator is available at GitHub.
For the full article series, start with Part 0: Why Should Your Care About Knowledge Graphs?
Part 1: From Data Engineering to Knowledge Engineering in the blink of an eye Get a knowledge graph running from a CSV in four lines of Python.
Part 2: Data Engineering Ontologies
Connect your data to existing ontologies for instant semantic enrichment.Part 3: SPARQL for SQL Developers
A translation guide for everything you already know.Part 4: From SQL Constraints to SHACL Shapes
Declarative data validation, the knowledge graph way.
About the author

Ontologist who code in C, Java and Python. Been a knowledge graph practitioner for over a decade, and had numerous talks on the topic around the globe. Author of SHACL for the Practitioner and awarded amongst Norway’s Top 50 Women in Tech 2024.