From Data Engineering to Knowledge Engineering in the blink of an eye
How to easily start constructing knowledge graphs using well known data engineering tools

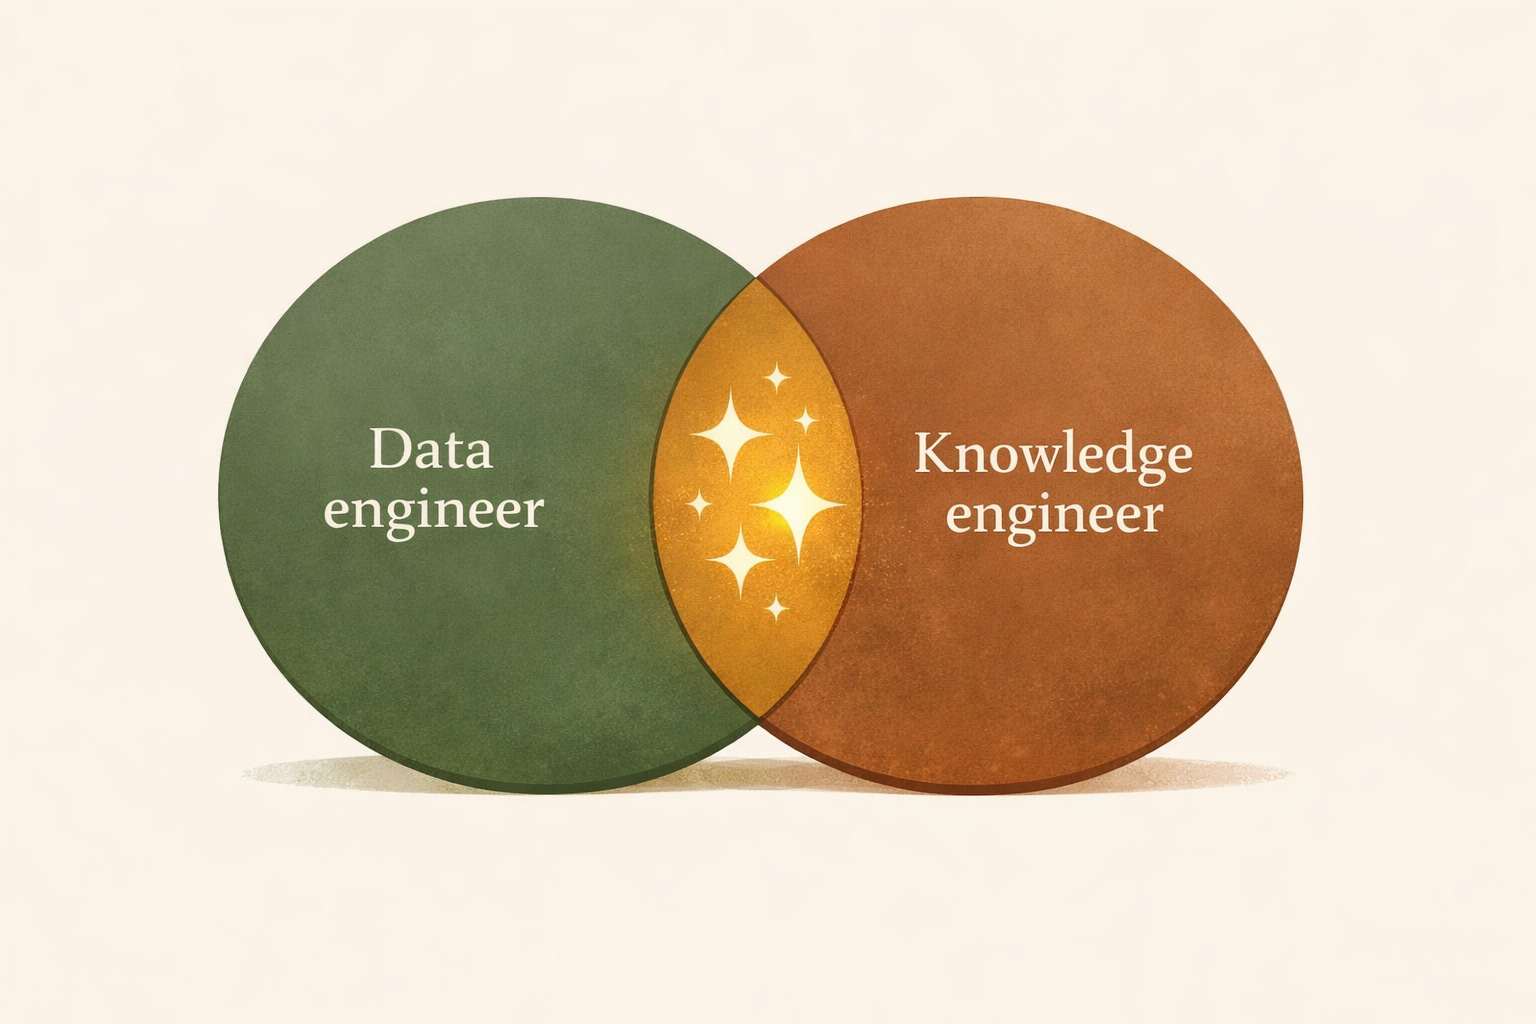
There are plenty of roles in action in any AI project. And their focus areas and toolbox are changing and expanding. In this article, I will give a practical approach to how you as a data engineer can work as a knowledge engineer with little or no knowledge of knowledge graphs. Just three facts are needed to know about knowledge graphs to get started.
Making assumptions, setting the scene
Assumption for a data engineer: Data engineers move data, structure data, and keep data trustworthy.
Assumption for a knowledge engineer: Knowledge engineers capture human understanding, formalise it, and make it usable for intelligent systems.
Traditionally, data engineering tasks has included (but is not limited to):
moving data through building and maintaining ETL pipelines, using SQL, Python, streams and workflow orchestration tools.
structuring data through pushing buttons in data warehouses, lakehouses and the like, transforming data through schemas with SQL.
keeping data trustworthy through monitoring software, SQL assertions, keeping metadata in schema registers and internal wikis.
While knowledge engineering tasks includes (but is not limited to):
capture human understanding, with good help from ontologists, through knowledge acquisition, using concept mapping tools, structured interviews and mind-mapping.
formalise it by converting informal understanding into precise, machine-readable structures using semantic technologies (RDF-stack), with surrounding tooling as ontology management systems.
making it usable for intelligent systems through reasoning and inference, enabling decision support, deriving new facts and insights, providing explainability in data.
Building robust ETL pipelines are essential for any data lifecycle management system, while applying semantics through knowledge engineering is essential for any successful AI system. Large Language Models (LLMs) and other GenAI inventions has not changed this fact, it has only made it clearer.
In regards to LLMs, you can say that a data engineer ensures that LLMs are grounded in correct, timely and retrievable data. While a knowledge engineer ensures that LLMs operate within meaningful, explainable, and safe semantic boundaries. Reducing hallucinations and false outputs. Hence, semantics are essential if you are building AI agents and other AI-based decision makers.
The things you need to know about knowledge graphs
We talk in triples subject predicate object, not tuples <key, value>.
We use global, unique identifiers (IRI) for all things. E.g.
http://data.veronahe.no/MarsWe are based on Knowledge Representation, discrete mathematics and foundational logic (as found in philosophy and computer science).
If you stick these three facts in the back of your mind, you should be good!
Step 0: Technical prerequisites
I am using Python with the frameworks Polars and maplib, CSV-files and SPARQL in this tutorial.
Step 1: Your data
It does not really matter how your data looks like. As long as you have data. As a data engineer, you probably know that pretty much anything can be parsed into a data frame. And that is what we are working on here.
Example data
I will create my data frame directly from a CSV, for the sake of example. The CSV I am using contain information about planets in the Solar System with a few data points.
import polars as pl

ns = "http://data.veronahe.no/"

df_planets = pl.read_csv("data/planets.csv")

# Create subject IRI for planets
df_planets = df_planets.with_columns(
  (ns + pl.col("planet")).alias("planet_iri")
)

df_planets = df_planets.select(
  ["planet",
   "planet_iri", # the new column we just made :-)
   "mean_temperature",
   "length_of_day",
   "orbital_period"
  ])
That’s it for the data engineering from my side this time! Let’s create knowledge graphs. ❤️
Step 2: Map your data
A template is a series of instructions for how to serialise your data frame into a knowledge graph. Remember the subject predicate object pattern.
Initialise a Knowledge Graph (Model) in maplib
from maplib import Model

m = Model()
We will serialise our data frame into a knowledge graph using maplib’s built-in default mapping, which creates a template based on our data frame content. We pass along our data frame and the name of our column containing subjects as arguments to this function.
m.map_default(df_planets, "planet_iri")After this step, your Model m is a knowledge graph containing triples derived from your data frame!
👀 If you happen to be interested; mapping in maplib is powered by Reasonable Ontology Templates (OTTR), a template language for knowledge graphs. Check it out if you want to dive into more sophisticated template building.
Step 3: Enrichment and extraction
You can enrich, update and manipulate your knowledge graph using SPARQL, the expressive query language for knowledge graphs. You can also extract a segment, or the complete, knowledge graph by using SPARQL.
A note on SPARQL
Although the keywords of SPARQL probably reminds you of SQL, there are a few fundamental differences. In this case, there is enough to know that we use triple pattern when asking for things, and that the things we ask for are represented as variable on the form ?var. A query selecting everything in a knowledge graph will then look like:
SELECT * WHERE { ?s ?p ?o }If you would like to know more about SPARQL, you can check out Ivo Velitchkov’s Wiki on SPARQL.
Enrichment
m.insert("""
  CONSTRUCT { ?s a <http://data.veronahe.no/Planet> }
  WHERE { ?s ?p ?o } """)
A construct-query will construct triples as the graph pattern provided on the conditions in the where-clause. In this case, we will insert the triple(s) that subject a Planet for all available subjects. Since we only have our planets (Mercury, Venus, Earth, etc.) in our graph, this will add the fact that these planets are indeed a Planet. a is the same as saying that this thing (?s) is an instance of the other thing (Planet).
Extraction
All m.query() returns a delightful Polars data frame.
df = m.query("""
  SELECT ?s
  WHERE {
    ?s <urn:maplib_default:mean_temperature> ?o
    FILTER(?o > 100)
  } """)
print(df)
This query returns all subjects (?s) that has some mean_temperature above 100. Resulting data frame as printed with print(df):
% python main.py
shape: (2, 1)
┌────────────────┐
│ s              │
│ ---            │
│ str            │
╞════════════════╡
│ data:Mercury   │
│ data:Venus     │
└────────────────┘
Summary
Data-to-knowledge graph in 1-2-3:
Prepare your data as a data frame
Map default in a maplib Model
Knowledge graph is ready for enrichment (through queries and reasoning) and extraction
from maplib import Model
import polars as pl

# from data
df_planets = pl.read_csv("data/planets.csv")

# to knowledge graph
m = Model()
m.map_default(df_planets, "planet_iri")

# data fram output ready to use
df_output = m.query("""SELECT * WHERE {?s ?p ?o}""")
This article has demonstrated how you can easily start constructing knowledge graphs using well known data engineering tools, using a bottom-up approach without the support of an ontology. In order to achieve the true wonders of a knowledge graph, an ontology is needed, but it does not have to be either huge or advanced, to harvest the power of reasoning.
A next step for you: spend an afternoon with an ontologist and learn how to map your data to existing domain or upper ontologies (like gist). For context, knowledge and accessible semantics to your data.
From Data Engineering to Knowledge Engineering article-series
Part 1: this
Part 2: Data Engineering Ontologies
Part 3: SPARQL for SQL Developers: A Translation Guide
Part 4: From SQL Constraints to SHACL Shapes: Declarative Data Validation
I work as both, Veronika. I’d venture:
An average data engineer barely understands what information means formally, and often understands data storage without fully understanding how critical the details of data capture is in the value of data as information.
A knowledge engineer is often trying to capture what humans call knowledge without any understanding of how it arose. Virtually nothing that is done in knowledge acquisition, representation, system design, validation or maintenance has anything to do with what makes knowledge knowledge rather than data curated and assembled as reusable information.
So I think they have the data engineer’s problem, only worse.
For those who are particularly interested in a template for the data frame in this example, the way a knowledge engineer would have designed it, take a look here: https://github.com/DataTreehouse/maplib-masterclass/blob/main/tpl/tpl.stottr